Following several experiments, the data presented on the graph below was obtained.What can you determine from this graph? 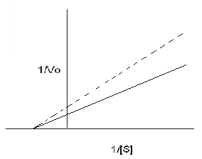
A) This data may have been collected both in the absence (solid line) and presence (dashed line) of a competitive inhibitor.
B) This data may have been collected both in the absence (solid line) and presence (dashed line) of a mixed (noncompetitive) inhibitor.
C) This data may have been collected both in the absence (solid line) and presence (dashed line) of mechanism based inhibitor.
D) This data may have been collected both in the absence (solid line) and presence (dashed line) of an inhibitor which binds the active site.
E) More than one of the above are correct.
Correct Answer:
Verified
Q42: The breakdown of dopamine is catalyzed by
Q44: The following data were collected under conditions
Q46: A new drug has been discovered which
Q47: Based on the figure in the question
Q48: A lab recently developed a new drug
Q48: At substrate concentrations much lower than the
Q50: From the graph below plotting data that
Q52: From the graph below plotting data that
Q52: An extremely efficient enzyme called "efficase" catalyzes
Q54: Enzyme E is responsible for conversion of
Unlock this Answer For Free Now!
View this answer and more for free by performing one of the following actions

Scan the QR code to install the App and get 2 free unlocks

Unlock quizzes for free by uploading documents