From the graph below plotting data that was collected under steady state conditions, velocity on the y-axis in units of μM/s and substrate concentration of the x-axis in units of μM, what is the Vmax? 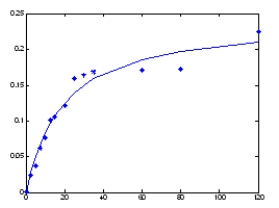
A) 0.24 μM/s
B) 18 μM
C) 0.2 μM
D) 0.24 μM
E) 0.12 μM/s
Correct Answer:
Verified
Q38: I propose to design a new drug
Q42: The breakdown of dopamine is catalyzed by
Q46: A new drug has been discovered which
Q47: Based on the figure in the question
Q48: A lab recently developed a new drug
Q48: At substrate concentrations much lower than the
Q49: Following several experiments, the data presented on
Q52: From the graph below plotting data that
Q52: An extremely efficient enzyme called "efficase" catalyzes
Q54: Enzyme E is responsible for conversion of
Unlock this Answer For Free Now!
View this answer and more for free by performing one of the following actions

Scan the QR code to install the App and get 2 free unlocks

Unlock quizzes for free by uploading documents