Multiple Choice
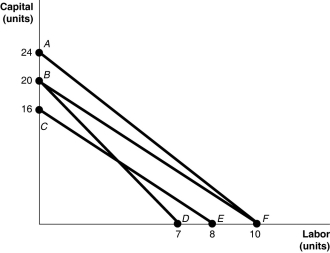
-Refer to Figure 7-13. The lines shown in the diagram are isocost lines. Which of the following shows an increase in the firm's total cost while the price of labour and capital remain unchanged?
A) the movement from CE to BF
B) the movement from CE to AF
C) the movement from BD to AF
D) the movement from BD to CE
Correct Answer:
Verified
Related Questions

