The following frequency distribution shows the monthly stock returns for Home Depot for the years 2003 through 2007. 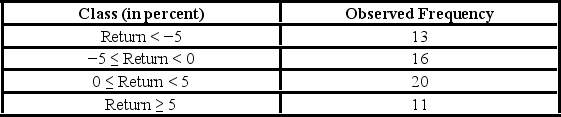 Over the time period, the following summary statistics are provided: Mean = 0.31%, Standard deviation = 6.49%, Skewness = 0.15, and Kurtosis = 0.38. For the goodness-of-fit test for normality, the null and alternative hypothesis are ________.
A) H0: The returns follow a normal distribution with mean 6.49% and standard deviation 0.31%; HA: The returns do not follow a normal distribution with mean 6.49% and standard deviation 0.31%
B) H0: The returns do not follow a normal distribution with mean 6.49% and standard deviation 0.31%; HA: The returns follow a normal distribution with mean 6.49% and standard deviation 0.31%
C) H0: The returns follow a normal distribution with mean 0.31% and standard deviation 6.49%; HA: The returns do not follow a normal distribution with mean 0.31% and standard deviation 6.49%
D) H0: The returns do not follow a normal distribution with mean 0.31% and standard deviation 6.49%; HA: The returns follow a normal distribution with mean 0.31% and standard deviation 6.49%
Correct Answer:
Verified
Q104: Suppose Bank of America would like to
Q105: The following table shows the cross-classification of
Q106: The following frequency distribution shows the monthly
Q107: The following frequency distribution shows the monthly
Q108: A researcher wants to determine if the
Q110: Suppose Bank of America would like to
Q111: The following frequency distribution shows the monthly
Q112: The following table shows the observed frequencies
Q113: A researcher wants to verify his belief
Q114: Suppose Bank of America would like to
Unlock this Answer For Free Now!
View this answer and more for free by performing one of the following actions

Scan the QR code to install the App and get 2 free unlocks

Unlock quizzes for free by uploading documents