Typically, the sales volume declines with an increase of a product price. It has been observed, however, that for some luxury goods the sales volume may increase when the price increases. The following scatterplot illustrates this rather unusual relationship. 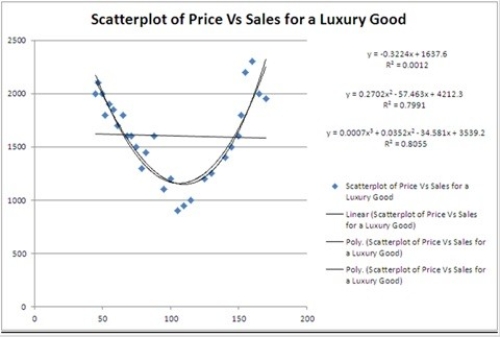 Which of the following models is most likely to be chosen in order to describe the relationship between Price and Sales?
A) Linear
B) Quadratic
C) Cubic
D) Exponential
Correct Answer:
Verified
Q55: Typically, the sales volume declines with an
Q56: For which of the following models is
Q57: Typically, the sales volume declines with an
Q58: Typically, the sales volume declines with an
Q59: In the model ln(y) = β0 +
Q61: The following data show the cooling temperatures
Q62: The linear and logarithmic models, y =
Q63: The following data, with the corresponding scatterplot,
Q64: The following data, with the corresponding Excel
Q65: The quadratic and logarithmic models, y =
Unlock this Answer For Free Now!
View this answer and more for free by performing one of the following actions

Scan the QR code to install the App and get 2 free unlocks

Unlock quizzes for free by uploading documents