The following data, with the corresponding Excel scatterplot, show the average growth rate of Weeping Higan cherry trees planted in Washington, DC. At the time of planting, the trees were one year old and were all six feet in height. 
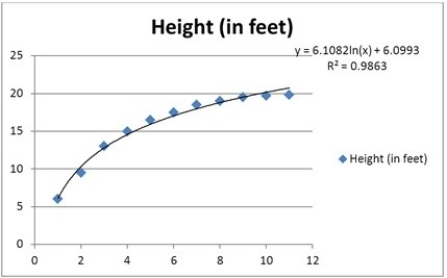 What percent of the variation in heights is explained by the model? ________.
A) 6.09
B) 6.10
C) 98.63
D) Can't determine from the given information
Correct Answer:
Verified
Q59: In the model ln(y) = β0 +
Q60: Typically, the sales volume declines with an
Q61: The following data show the cooling temperatures
Q62: The linear and logarithmic models, y =
Q63: The following data, with the corresponding scatterplot,
Q65: The quadratic and logarithmic models, y =
Q66: The following data show the cooling temperatures
Q67: The following data show the cooling temperatures
Q68: Which of the following regression models is
Q69: Which of the following regression models is
Unlock this Answer For Free Now!
View this answer and more for free by performing one of the following actions

Scan the QR code to install the App and get 2 free unlocks

Unlock quizzes for free by uploading documents