The figure shows a graph of the position x as a function of time t for a system undergoing simple harmonic motion. Which one of the following graphs represents the velocity of this system as a function of time? 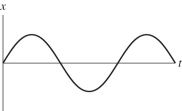 a)
a) 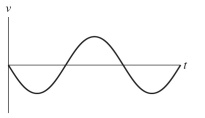
b) 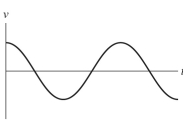
c) 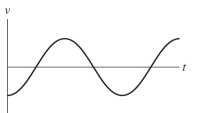
d) 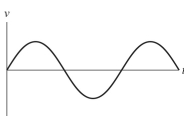
A) graph a
B) graph b
C) graph c
D) graph d
Correct Answer:
Verified
Q1: If we double the frequency of a
Q2: An object that hangs from the ceiling
Q4: Two simple pendulums, A and B,
Q4: An object is attached to a vertical
Q7: The figure shows a graph of the
Q8: Identical balls oscillate with the same period
Q9: In simple harmonic motion,when is the magnitude
Q18: In simple harmonic motion,when is the speed
Q19: An object is attached to a vertical
Q20: Grandfather clocks are designed so they can
Unlock this Answer For Free Now!
View this answer and more for free by performing one of the following actions

Scan the QR code to install the App and get 2 free unlocks

Unlock quizzes for free by uploading documents