The graph in the figure shows the net force acting on a 3.0-kg object as a function of time. 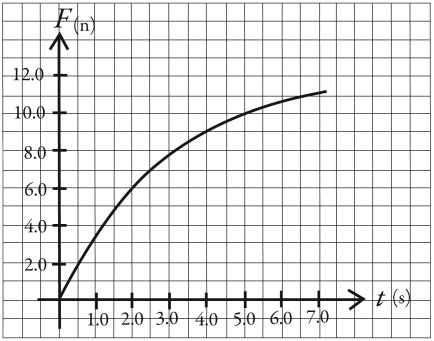 (a)What is the acceleration of this object at time t = 2.0 s?
(b)Draw,to scale,a graph of the acceleration of this object as a function of time over the range  to
to  .
.
Correct Answer:
Verified
(b)The acceleration...
View Answer
Unlock this answer now
Get Access to more Verified Answers free of charge
Q34: The figure shows a graph of the
Q35: A 7.0-kg object is acted on by
Q36: A block is on a frictionless horizontal
Q37: The figure shows an acceleration-versus-force graph for
Q38: A 50.0-N box is sliding on a
Q39: A series of weights connected by very
Q40: 15)Bumpers on cars are not of much
Q41: The figure shows a graph of the
Q42: The graph in the figure shows the
Q43: Two forces act on a 
Unlock this Answer For Free Now!
View this answer and more for free by performing one of the following actions

Scan the QR code to install the App and get 2 free unlocks

Unlock quizzes for free by uploading documents