Figure 6.11 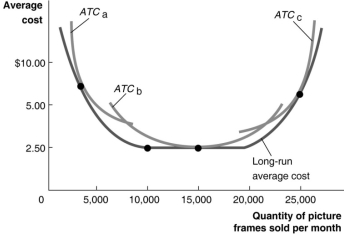 Figure 6.11 illustrates the long-run average cost curve for a firm that produces picture frames. The graph also includes short-run average cost curves for three firm sizes: ATCa, ATCb, and ATCc.
-Refer to Figure 6.11.Constant returns to scale __________.
A) occur for output rates greater than 5 000 picture frames
B) occur between 5 000 and 20 000 picture frames per month
C) occur between 10 000 and 20 000 pictures frames per month
D) will shift the long-run average cost curve downward
Correct Answer:
Verified
Q221: In the long run,
A)the firm's fixed costs
Q229: Figure 6.11 Q230: When do diseconomies of scale occur? Q232: Figure 6.10 Q232: When do economies of scale occur? Q232: Which of the following statements regarding a Q234: Figure 6.11 Q236: If an airport decides to expand by Q238: Figure 6.10 Q257: If an airport decides to expand by Unlock this Answer For Free Now! View this answer and more for free by performing one of the following actions Scan the QR code to install the App and get 2 free unlocks Unlock quizzes for free by uploading documents![]()
A)When long-run![]()
A)When a![]()
![]()

