Multiple Choice
Figure 6.11 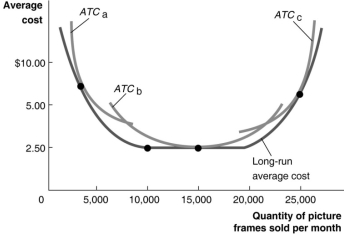 Figure 6.11 illustrates the long-run average cost curve for a firm that produces picture frames. The graph also includes short-run average cost curves for three firm sizes: ATCa, ATCb, and ATCc.
-Refer to Figure 6.11.If the firm chooses to produce and sell 25 000 frames per month by operating in the short run with a scale operation represented by ATCc,_________.
A) the firm will not be operating efficiently
B) the firm will be operating efficiently
C) the firm would lower its average costs by reducing its scale of operation
D) the firm will not be able to earn a profit
Correct Answer:
Verified
Related Questions
Q221: In the long run,
A)the firm's fixed costs
Q222: Which of the following is not a

