The figure shows the graph of the position x as a function of time for an object moving in the straight line (the x-axis) .Which of the following graphs best describes the velocity along the x-axis as a function of time for this object? 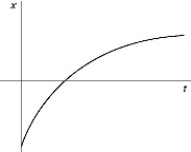
A) 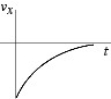
B) 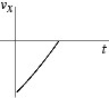
C) 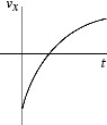
D) 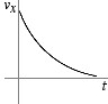
E) 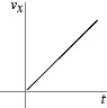
Correct Answer:
Verified
Q5: As part of an exercise program,a woman
Q6: The graph in the figure shows the
Q8: A cat runs along a straight line
Q9: The figure represents the position of a
Q10: The motion of a particle is described
Q11: The motions of a car and a
Q14: The figure shows the position of an
Q24: Arthur and Betty start walking toward each
Q28: The velocity of an object is given
Q32: If the fastest you can safely drive
Unlock this Answer For Free Now!
View this answer and more for free by performing one of the following actions

Scan the QR code to install the App and get 2 free unlocks

Unlock quizzes for free by uploading documents