An object starts its motion with a constant velocity of 2.0 m/s toward the east.After 3.0 s,the object stops for 1.0 s.The object then moves toward the west a distance of 2.0 m in 3.0 s.The object continues traveling in the same direction,but increases its speed by 1.0 m/s for the next 2.0 s.Which graph below could represent the motion of this object?
A) 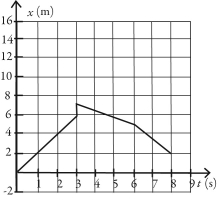
B) 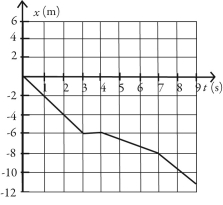
C) 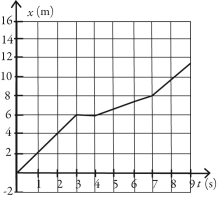
D) 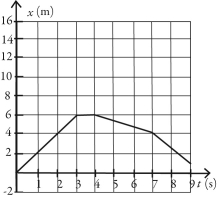
Correct Answer:
Verified
Q1: The figure shows a graph of the
Q2: The position of an object as a
Q3: The figure shows the position of an
Q5: As part of an exercise program,a woman
Q6: The graph in the figure shows the
Q8: A cat runs along a straight line
Q9: The figure represents the position of a
Q10: The motion of a particle is described
Q11: The motions of a car and a
Q28: The velocity of an object is given
Unlock this Answer For Free Now!
View this answer and more for free by performing one of the following actions

Scan the QR code to install the App and get 2 free unlocks

Unlock quizzes for free by uploading documents