The figure shows a graph of the velocity as a function of time for a basketball player traveling up and down the court in a straight-line path.For the 10 s shown on the graph,find
(a)the net displacement of the player.
(b)the total distance run by the player. 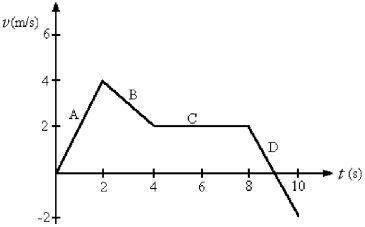
Correct Answer:
Verified
Q2: The position of an object as a
Q3: The figure shows the position of an
Q4: An object starts its motion with a
Q5: As part of an exercise program,a woman
Q6: The graph in the figure shows the
Q8: A cat runs along a straight line
Q9: The figure represents the position of a
Q10: The motion of a particle is described
Q11: The motions of a car and a
Q28: The velocity of an object is given
Unlock this Answer For Free Now!
View this answer and more for free by performing one of the following actions

Scan the QR code to install the App and get 2 free unlocks

Unlock quizzes for free by uploading documents