A graph of the force on an object as a function of its position is shown in the figure. Determine the amount of work done by this force on an object that moves from x = 1.0 m to x = 6.0 m. (Assume an accuracy of 2 significant figures for the numbers on the graph.) 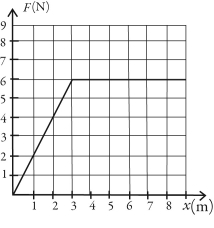
A) 26 J
B) 29 J
C) 22 J
D) 35 J
E) 27 J
Correct Answer:
Verified
Q2: A box of mass m is pressed
Q3: Two objects,one of mass m and the
Q5: A 4.0-kg object is moving with speed
Q5: Swimmers at a water park have a
Q5: A ball drops some distance and gains
Q6: A ball drops some distance and loses
Q15: When an object is solely under the
Q16: Two identical balls are thrown directly upward,ball
Q17: If a force always acts perpendicular to
Q20: A stock person at the local grocery
Unlock this Answer For Free Now!
View this answer and more for free by performing one of the following actions

Scan the QR code to install the App and get 2 free unlocks

Unlock quizzes for free by uploading documents