The following diagram is a cost-volume-profit graph for a manufacturing company: The formula to determine the Y-axis value (£) at point D on the graph is as follows: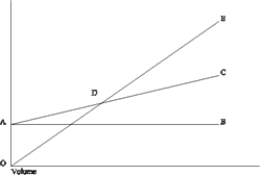
A) Fixed costs + (Variable costs per unit × Number of units)
B) ΣXY - bΣX
C) Fixed costs/Unit contribution margin
D) Fixed costs/Contribution margin ratio
Correct Answer:
Verified
Q23: In a cost-volume-profit graph, the slope of
Q25: Using cost-volume-profit analysis, we can conclude that
Q28: Which of the following assumptions does NOT
Q33: Assuming all other things are the same,
Q36: A profit-volume graph
A)measures profit or loss on
Q37: Which of the following statements is TRUE?
A)The
Q38: Assuming all other things are the same,
Q42: The following diagram is a cost-volume-profit graph
Q47: The income statement for Thomas Manufacturing Company
Q49: The following diagram is a cost-volume-profit graph
Unlock this Answer For Free Now!
View this answer and more for free by performing one of the following actions

Scan the QR code to install the App and get 2 free unlocks

Unlock quizzes for free by uploading documents