Figure 18-2 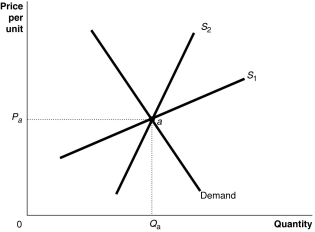
-Refer to Figure 18-2.The figure above shows a demand curve and two supply curves,one more elastic than the other.Use Figure 18-2 to answer the following questions.
a.Suppose the government imposes an excise tax of $1.00 on every unit sold.Use the graph to illustrate the impact of this tax.
b.If the government imposes an excise tax of $1.00 on every unit sold,will the consumer pay more of the tax if the supply curve is S1 or S2? Refer to the graphs in your answer.
c.If an excise tax of $1.00 on every unit sold is imposed,will the revenue collected by the government be greater if the supply curve is S1 or S2?
d.If the government imposes an excise tax of $1.00 on every unit sold,will the deadweight loss be greater if the supply curve is S1 or S2?
Correct Answer:
Verified
View Answer
Unlock this answer now
Get Access to more Verified Answers free of charge
Q104: Figure 18-3 Q105: The federal government defines the poverty line Q108: Figure 18-3 Q192: Explain why it is more difficult to Q195: When the demand for a product is Q198: If grocery stores were legally required to Q225: As a group, people with high incomes Q231: All Gini coefficients must lie between 0 Q235: What does a Lorenz curve illustrate? Q239: Which of the following statements best represents![]()
![]()
A)a comparison
Unlock this Answer For Free Now!
View this answer and more for free by performing one of the following actions

Scan the QR code to install the App and get 2 free unlocks

Unlock quizzes for free by uploading documents