Figure 18-3 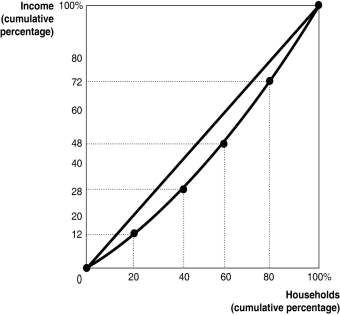 Figure 18-3 shows the Lorenz curve for a hypothetical country.
-Refer to Figure 18-3.The second lowest 20 percent of households
A) earn 12 percent of the society's total income.
B) earn 16 percent of the society's total income.
C) earn 28 percent of the society's total income.
D) earn 40 percent of the society's total income.
Correct Answer:
Verified
Q105: The federal government defines the poverty line
Q107: Figure 18-2 Q108: Figure 18-3 Q159: The complexity of the U.S.federal income tax Q186: There is a difference between who is Q195: When the demand for a product is Q198: If grocery stores were legally required to Q230: The poverty rate is defined as the Q235: What does a Lorenz curve illustrate? Q239: Which of the following statements best represents![]()
![]()
A)a comparison
Unlock this Answer For Free Now!
View this answer and more for free by performing one of the following actions

Scan the QR code to install the App and get 2 free unlocks

Unlock quizzes for free by uploading documents