Multiple Choice
Figure 13-4 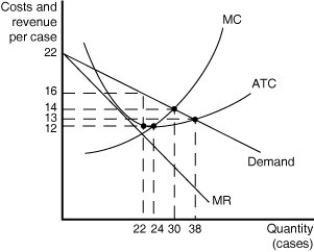 Figure 13-4 shows cost and demand curves for a monopolistically competitive producer of iced-tea.
-Refer to Figure 13-4.What is the profit-maximizing output level?
A) 22 cases
B) 24 cases
C) 30 cases
D) 38 cases
Correct Answer:
Verified
Related Questions

