Figure 13-4 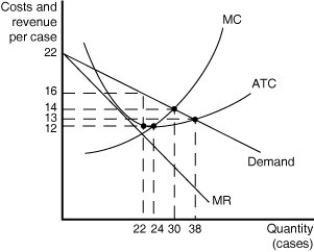 Figure 13-4 shows cost and demand curves for a monopolistically competitive producer of iced-tea.
-Refer to Figure 13-4.Based on the diagram,one can conclude that
A) some existing firms will exit the market.
B) new firms will enter the market.
C) the industry is in long-run equilibrium.
D) firms achieve productive efficiency.
Correct Answer:
Verified
Q51: Table 13-2 Q52: Figure 13-4 Q54: Table 13-1 Q60: Figure 13-5 Q90: A monopolistically competitive firm is producing an Q94: The profit-maximizing rule for a monopolistically competitive Q104: A monopolistically competitive firm should lower its Q105: Unlike a perfectly competitive firm, a monopolistic Q114: Figure 13-6 Q141: One reason Starbucks experienced a decline in Unlock this Answer For Free Now! View this answer and more for free by performing one of the following actions Scan the QR code to install the App and get 2 free unlocks Unlock quizzes for free by uploading documents
![]()
![]()
![]()
![]()
![]()

