Figure 12-8 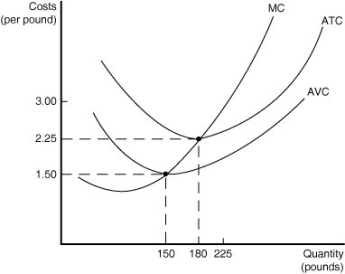
-Refer to Figure 12-8.The figure above shows the cost curves of a perfectly competitive firm in the coffee market.Use the graph in Figure 12-8 to answer the following questions.Assume the market price is $3 per pound.
a.What is the lowest price at which the coffee grower will supply output in the short run?
b.In the diagram draw the firm's demand curve (label this "MR" for marginal revenue).
c.What is the firm's profit-maximizing output?
d.Is the firm earning a profit or a loss? Identify the area in the graph that represents the firm's profit or loss.
e.Explain how entry or exit will occur in the market to ensure that firms will break even in the long run.
Correct Answer:
Verified
View Answer
Unlock this answer now
Get Access to more Verified Answers free of charge
Q129: Figure 12-7 Q135: Figure 12-7 Q242: If a firm in a perfectly competitive Q247: A firm would decide to shut down Q257: In a decreasing-cost industry, the entry of Q260: Assume that firms in a perfectly competitive Q266: In the long run, perfectly competitive firms Q268: Which of the following does not hold Q278: Assume that the personal computer industry is Q287: A perfectly competitive industry achieves allocative efficiency![]()
![]()
Unlock this Answer For Free Now!
View this answer and more for free by performing one of the following actions

Scan the QR code to install the App and get 2 free unlocks

Unlock quizzes for free by uploading documents