Multiple Choice
Figure 4-5 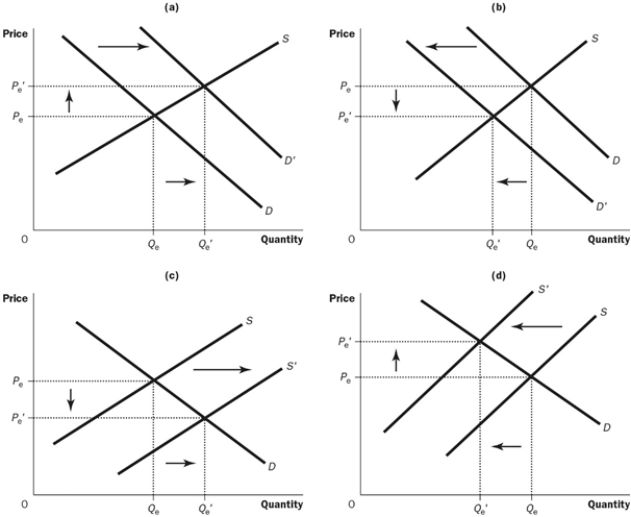
-Refer to the Figure 4-5. Which of the following is shown in Graph C?
A) a decrease in demand
B) a decrease in the number of sellers
C) an increase in supply
D) an increase in input prices
Correct Answer:
Verified
Related Questions
Q188: Suppose there is an earthquake that destroys
Q189: Which chain of events is listed in
Q190: Figure 4-5 Q191: What would an early frost in the Q192: If the supply of a product decreases, Q194: If the supply of a product increases, Q195: Suppose that the number of buyers in![]()
Unlock this Answer For Free Now!
View this answer and more for free by performing one of the following actions

Scan the QR code to install the App and get 2 free unlocks

Unlock quizzes for free by uploading documents