The following figure shows the production possibilities frontier for Good A and Good B.In the figure below,point f represents: Figure 2.2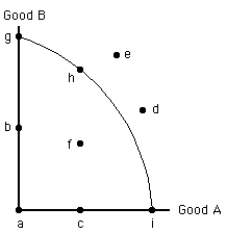
A) an efficient combination of Good A and Good B.
B) the only efficient combination of Good A and Good B.
C) the combination of Good A and Good B that the economy will produce.
D) an inefficient combination of Good A and Good B.
E) the only inefficient combination of Good A and Good B.
Correct Answer:
Verified
Q93: On a bowed-out production possibilities frontier showing
Q98: The law of increasing opportunity cost reflects
Q108: The figure given below shows the production
Q114: The figure below shows the production possibilities
Q115: The figure below shows the production possibilities
Q116: The figure below shows the production possibilities
Q117: The figure below shows the production possibilities
Q122: Points outside the production possibilities frontier represent
A)unemployment
Q127: If the production possibilities frontier is a
Q140: The law of increasing opportunity cost explains
Unlock this Answer For Free Now!
View this answer and more for free by performing one of the following actions

Scan the QR code to install the App and get 2 free unlocks

Unlock quizzes for free by uploading documents