The figure given below shows the production possibilities frontier for Good A and Good B.In the figure below,when moving from point f to point g,the production of: Figure 2.2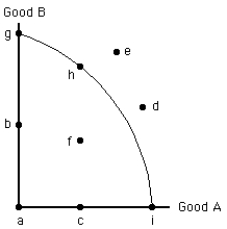
A) Good B increases without a change in the production of Good A.
B) Good A increases without a change in the production of Good B.
C) both Good A and Good B increase.
D) both Good A and Good B decrease.
E) Good B increases and the production of Good A decreases.
Correct Answer:
Verified
Q68: Points inside the production possibilities frontier represent:
A)full
Q95: If an economy is operating at a
Q98: The law of increasing opportunity cost reflects
Q103: The figure given below shows the production
Q104: The following figure shows the production possibilities
Q113: The following figure shows the production possibilities
Q122: Points outside the production possibilities frontier represent
A)unemployment
Q127: If the production possibilities frontier is a
Q130: Along a bowed-out production possibilities frontier, as
Q140: The law of increasing opportunity cost explains
Unlock this Answer For Free Now!
View this answer and more for free by performing one of the following actions

Scan the QR code to install the App and get 2 free unlocks

Unlock quizzes for free by uploading documents