In the figure given below,which of the following is true at the price ceiling,P?
Figure 4.8
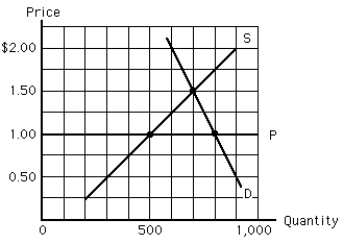
A) Excess quantity supplied equals 300 gallons.
B) Excess quantity demanded equals 300 gallons.
C) Excess quantity supplied equals 500 gallons.
D) Excess quantity demanded equals 800 gallons.
E) Quantity demanded will be equal to quantity supplied.
Correct Answer:
Verified
Q122: If the government imposes a ceiling price
Q124: Suppose a market is in equilibrium.If a
Q125: Suppose current equilibrium price of pizza is
Q128: Suppose a market is in equilibrium.If a
Q134: Suppose a price floor for a good
Q135: Rent controls usually result in:
A)an economic profit
Q147: In a rental market like the one
Q149: In the figure given below,a price floor
Q150: As shown in the figure given below,when
Q151: In the figure given below,the number of
Unlock this Answer For Free Now!
View this answer and more for free by performing one of the following actions

Scan the QR code to install the App and get 2 free unlocks

Unlock quizzes for free by uploading documents