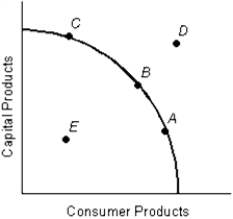
Figure 1.3

-Opportunity cost is best defined as:
A) the sum of all alternatives given up when a choice is made.
B) the money spent once a choice is made.
C) the highest-valued alternative given up when a choice is made.
D) the difference between the cost price and the selling price of a good.
E) the cost of capital resources used in the production of additional capital.
Correct Answer:
Verified
Q1: Following is the production possibilities schedule for
Q2: Figure 1.3 Q3: Figure 1.3 Q4: Following is the production possibilities schedule for Q6: Figure 1.3 Q7: Following is the production possibilities schedule for Q8: Following is the production possibilities schedule for Q9: Following is the production possibilities schedule for Q10: Figure 1.3 Q11: Figure 1.3 Unlock this Answer For Free Now! View this answer and more for free by performing one of the following actions Scan the QR code to install the App and get 2 free unlocks Unlock quizzes for free by uploading documents
![]()
![]()
![]()
![]()
![]()

