Figure 1.3
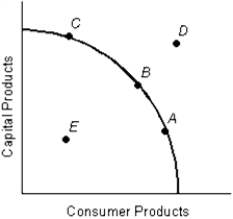
-The tradeoffs faced by a society can be illustrated in a graph known as the:
A) production operations curve.
B) production cost curve.
C) production cost model.
D) production cost forecast curve.
E) production possibilities curve.
Correct Answer:
Verified
Q1: Following is the production possibilities schedule for
Q3: Figure 1.3 Q4: Following is the production possibilities schedule for Q5: Figure 1.3 Q6: Figure 1.3 Q7: Following is the production possibilities schedule for Q8: Following is the production possibilities schedule for Q9: Following is the production possibilities schedule for Q10: Figure 1.3 Q11: Figure 1.3 Unlock this Answer For Free Now! View this answer and more for free by performing one of the following actions Scan the QR code to install the App and get 2 free unlocks Unlock quizzes for free by uploading documents
![]()
![]()
![]()
![]()
![]()

