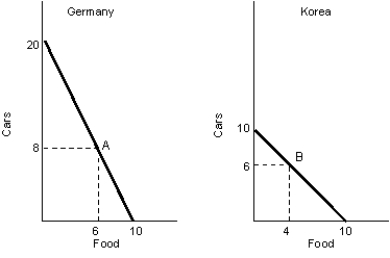
The figure given below represents the PPC in two nations - Germany and Korea, producing only two goods, cars and food.Figure 2.4
-Which of the following determines the quantity demanded of a commodity?
A) The income levels of consumers
B) The price of the commodity
C) The prices of related commodities
D) The number of buyers
E) Consumers' expectations
Correct Answer:
Verified
Q8: The figure given below represents the PPC
Q9: The figure given below represents the PPC
Q10: The figure given below represents the PPC
Q11: The figure given below represents the PPC
Q12: The figure given below represents the PPC
Q14: The figure given below represents the PPC
Q15: The figure given below represents the PPC
Q16: The figure given below represents the PPC
Q17: The figure given below represents the PPC
Q18: The figure given below represents the PPC
Unlock this Answer For Free Now!
View this answer and more for free by performing one of the following actions

Scan the QR code to install the App and get 2 free unlocks

Unlock quizzes for free by uploading documents