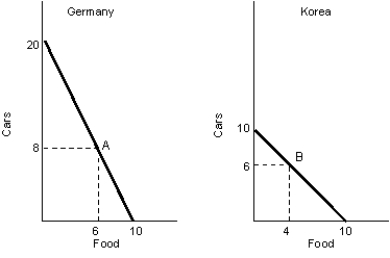
The figure given below represents the PPC in two nations - Germany and Korea, producing only two goods, cars and food.Figure 2.4
-The market demand curve is derived by:
A) studying an individual's demand for a product over a year.
B) comparing the monthly consumption of a group of people.
C) surveying a set of consumers and ascertaining their preferences.
D) adding up the quantities that consumers in a market are willing and able to purchase at each price.
E) calculating the average price a random sample of consumers are willing to pay for a product.
Correct Answer:
Verified
Q3: The figure given below represents the PPC
Q4: The figure given below represents the PPC
Q5: The figure given below represents the PPC
Q6: The figure given below represents the PPC
Q7: The figure given below represents the PPC
Q9: The figure given below represents the PPC
Q10: The figure given below represents the PPC
Q11: The figure given below represents the PPC
Q12: The figure given below represents the PPC
Q13: The figure given below represents the PPC
Unlock this Answer For Free Now!
View this answer and more for free by performing one of the following actions

Scan the QR code to install the App and get 2 free unlocks

Unlock quizzes for free by uploading documents