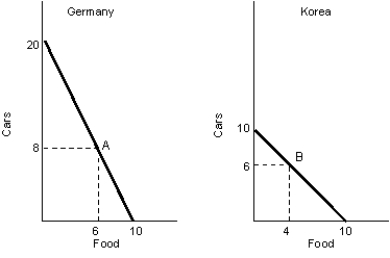
The figure given below represents the PPC in two nations - Germany and Korea, producing only two goods, cars and food.Figure 2.4
-The downward slope of the demand curve is attributed to:
A) the inverse relationship between price and quantity demanded.
B) the direct relationship between income and quantity demanded.
C) the direct relationship between price and quantity demanded.
D) the inverse relationship between income and quantity demanded.
E) the direct relationship between consumer preferences and quantity demanded.
Correct Answer:
Verified
Q1: The figure given below represents the PPC
Q2: The figure given below represents the PPC
Q4: The figure given below represents the PPC
Q5: The figure given below represents the PPC
Q6: The figure given below represents the PPC
Q7: The figure given below represents the PPC
Q8: The figure given below represents the PPC
Q9: The figure given below represents the PPC
Q10: The figure given below represents the PPC
Q11: The figure given below represents the PPC
Unlock this Answer For Free Now!
View this answer and more for free by performing one of the following actions

Scan the QR code to install the App and get 2 free unlocks

Unlock quizzes for free by uploading documents