Figure 5.2. The figure shows the supply and demand curves of a firm. 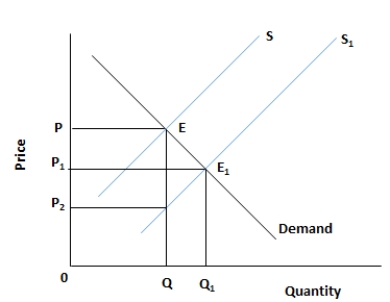
-Refer to figure 5.2. An increase in the cost of production will lead to a(n) :
A) rightward shift in the supply curve of the product, S.
B) leftward shift in the supply curve of the product, S.
C) upward movement along the supply curve of the product, S.
D) downward movement along the supply curve of the product, S.
E) rightward movement along the demand curve of the product.
Correct Answer:
Verified
Q22: Figure 5.2. The figure shows the supply
Q23: Figure 5.2. The figure shows the supply
Q24: Figure 5.2. The figure shows the supply
Q25: Figure 5.2. The figure shows the supply
Q26: Figure 5.2. The figure shows the supply
Q28: Figure 5.2. The figure shows the supply
Q29: Figure 5.2. The figure shows the supply
Q30: Figure 5.2. The figure shows the supply
Q31: Figure 5.2. The figure shows the supply
Q32: Figure 5.2. The figure shows the supply
Unlock this Answer For Free Now!
View this answer and more for free by performing one of the following actions

Scan the QR code to install the App and get 2 free unlocks

Unlock quizzes for free by uploading documents