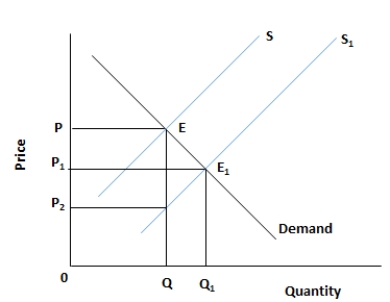
Figure 5.2. The figure shows the supply and demand curves of a firm. 
-Which of the following possibly determines the allocation of goods and services in a free market?
A) The availability of raw materials
B) The cost of production
C) The level of government intervention
D) The ability of the producers to produce a differentiated product
E) The willingness and ability of consumers to pay for the product
Correct Answer:
Verified
Q23: Figure 5.2. The figure shows the supply
Q24: Figure 5.2. The figure shows the supply
Q25: Figure 5.2. The figure shows the supply
Q26: Figure 5.2. The figure shows the supply
Q27: Figure 5.2. The figure shows the supply
Q29: Figure 5.2. The figure shows the supply
Q30: Figure 5.2. The figure shows the supply
Q31: Figure 5.2. The figure shows the supply
Q32: Figure 5.2. The figure shows the supply
Q33: Figure 5.1. The figure shows a linear
Unlock this Answer For Free Now!
View this answer and more for free by performing one of the following actions

Scan the QR code to install the App and get 2 free unlocks

Unlock quizzes for free by uploading documents