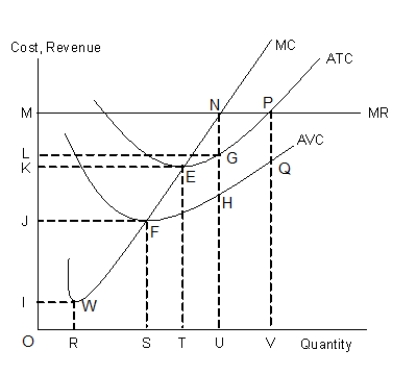
The figure given below shows the revenue and cost curves of a perfectly competitive firm.Figure 10.1
-Suppose that in a perfectly competitive market, the market supply of a good increases. As a result, the individual firm's:
A) supply curve would shift outward and the firm would increase output.
B) supply curve would shift inward and the firm would decrease output.
C) average-total-cost curve would shift upward and the firm would increase output.
D) marginal-revenue curve would shift upward and the firm would increase output.
E) marginal-revenue curve would shift downward and the firm would decrease output.
Correct Answer:
Verified
Q43: The figure given below shows the revenue
Q44: The figure given below shows the revenue
Q45: The figure given below shows the revenue
Q46: The figure given below shows the revenue
Q47: The figure given below shows the revenue
Q49: The figure given below shows the revenue
Q50: The figure given below shows the revenue
Q51: The figure given below shows the revenue
Q52: The figure given below shows the revenue
Q53: The figure given below shows the revenue
Unlock this Answer For Free Now!
View this answer and more for free by performing one of the following actions

Scan the QR code to install the App and get 2 free unlocks

Unlock quizzes for free by uploading documents