The figure given below shows the revenue and cost curves of a perfectly competitive firm.Figure 10.2
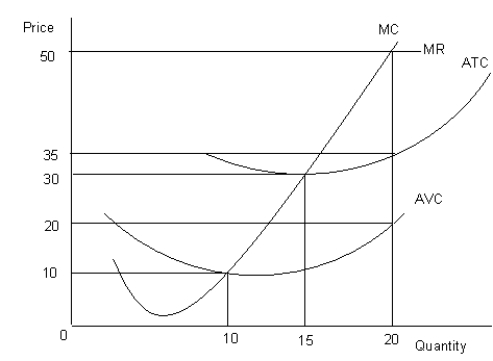 MC: Marginal cost curve
MR: Marginal revenue curve
ATC: Average-total-cost curve
AVC: Average-variable-cost curve
-In the short run, a firm continues to produce only if it can cover the:
A) fixed costs.
B) sunk costs.
C) explicit costs.
D) variable costs.
E) implicit costs.
Correct Answer:
Verified
Q40: The table given below shows the total
Q41: The figure given below shows the revenue
Q42: The figure given below shows the revenue
Q43: The figure given below shows the revenue
Q44: The figure given below shows the revenue
Q46: The figure given below shows the revenue
Q47: The figure given below shows the revenue
Q48: The figure given below shows the revenue
Q49: The figure given below shows the revenue
Q50: The figure given below shows the revenue
Unlock this Answer For Free Now!
View this answer and more for free by performing one of the following actions

Scan the QR code to install the App and get 2 free unlocks

Unlock quizzes for free by uploading documents