The figure given below shows the revenue and the cost curves of a perfectly competitive firm.Figure 10.3
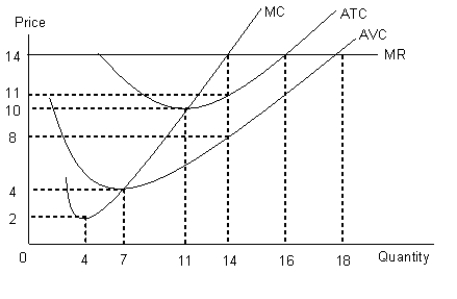
-Refer to Figure 10.3 and identify the price level at which the firm earns normal profit.
A) $4
B) $8
C) $10
D) $2
E) $14
Correct Answer:
Verified
Q57: The figure given below shows the revenue
Q58: The figure given below shows the revenue
Q59: The figure given below shows the revenue
Q60: The figure given below shows the revenue
Q61: The figure given below shows the revenue
Q63: The figure given below shows the revenue
Q64: The figure given below shows the revenue
Q65: The figure given below shows the demand
Q66: The figure given below shows the demand
Q67: The figure given below shows the revenue
Unlock this Answer For Free Now!
View this answer and more for free by performing one of the following actions

Scan the QR code to install the App and get 2 free unlocks

Unlock quizzes for free by uploading documents