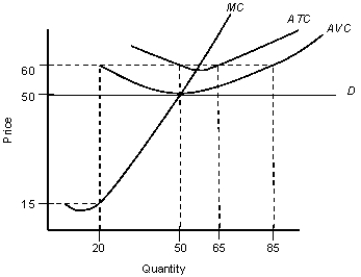
The figure given below shows the demand and cost curves of a perfectly competitive firm.Figure: 10.4
 D: Demand curve
MC: Marginal cost curve
ATC: Average-total cost curve
AVC: Average-variable-cost curve
-Suppose a firm in a perfectly competitive market is operating at its profit-maximizing level of output. Will the firm suspend operations if it faces a reduction in the price it can charge for its product?
A) No, because it can always raise its prices in the short run.
B) No, because it can always raise its prices in the long run.
C) No, as long as the firm earns sufficient revenue to pay all of the variable costs.
D) Yes, since it never makes sense to operate at a loss, even in the short run.
E) No, because it always makes sense to operate at a loss, even in the long run.
Correct Answer:
Verified
Q60: The figure given below shows the revenue
Q61: The figure given below shows the revenue
Q62: The figure given below shows the revenue
Q63: The figure given below shows the revenue
Q64: The figure given below shows the revenue
Q66: The figure given below shows the demand
Q67: The figure given below shows the revenue
Q68: The figure given below shows the revenue
Q69: The figure given below shows the demand
Q70: The figure given below shows the demand
Unlock this Answer For Free Now!
View this answer and more for free by performing one of the following actions

Scan the QR code to install the App and get 2 free unlocks

Unlock quizzes for free by uploading documents