The figure given below shows the demand curves of two classes of buyers, for tickets to a football match.Figure 11.4
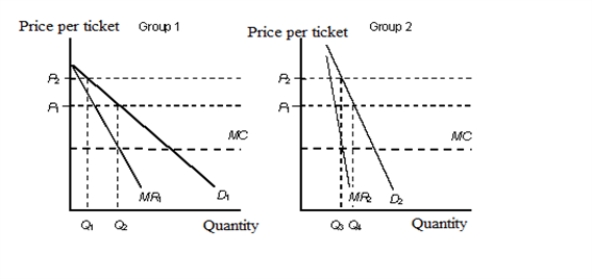 D1: Demand curve of group 1
D2: Demand curve of group 2
MR1: Marginal revenue of group 1
MR2: Marginal revenue of group 2
MC: Marginal cost
-Refer to Figure 11.4. What price must be charged from each group to maximize profits?
A) Both groups must be charged P1 .
B) Both groups must be charged P2 .
C) Group 1 must be charged P1 and group 2 must be charged P2.
D) Group 1 must be charged P2 and group 2 must be charged P1.
E) Both the groups must be charged a price that is equal to the marginal cost.
Correct Answer:
Verified
Q73: The following figure shows the revenue curves
Q74: The figure given below shows the demand
Q75: The figure below shows the market equilibrium
Q76: The following figures show the demand and
Q77: The figure given below shows the demand
Q79: The figure below shows the market equilibrium
Q80: The following figures show the demand and
Q81: The figure given below shows the cost
Q82: The figure given below shows the cost
Q83: The figure given below shows the cost
Unlock this Answer For Free Now!
View this answer and more for free by performing one of the following actions

Scan the QR code to install the App and get 2 free unlocks

Unlock quizzes for free by uploading documents