The figure below shows the market equilibrium (point B) at the intersection of demand and supply curves under perfect competition.Figure 11.5
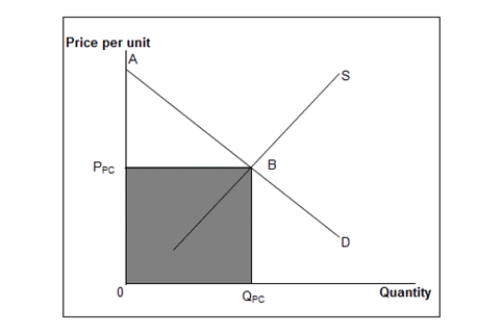 D: Market demand curve
S: Market supply curve
-Refer to Figure 11.5. Which of the following regions on the graph represents consumer surplus in a perfectly competitive market?
A) The area PPCBA
B) The area 0BPPC
C) The area 0BA
D) Half of area PPCBA
E) The area ABS
Correct Answer:
Verified
Q70: The figure below shows the market equilibrium
Q71: The following table shows the marginal revenues
Q72: The following figures show the demand and
Q73: The following figure shows the revenue curves
Q74: The figure given below shows the demand
Q76: The following figures show the demand and
Q77: The figure given below shows the demand
Q78: The figure given below shows the demand
Q79: The figure below shows the market equilibrium
Q80: The following figures show the demand and
Unlock this Answer For Free Now!
View this answer and more for free by performing one of the following actions

Scan the QR code to install the App and get 2 free unlocks

Unlock quizzes for free by uploading documents