The figure given below shows the demand curves of two classes of buyers, for tickets to a football match.Figure 11.4
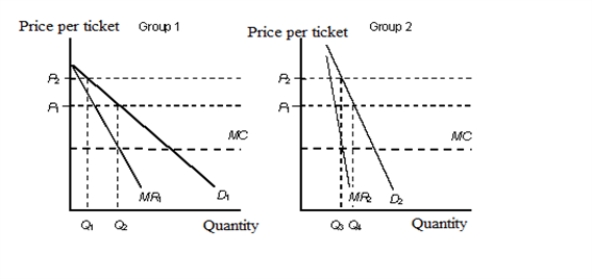 D1: Demand curve of group 1
D2: Demand curve of group 2
MR1: Marginal revenue of group 1
MR2: Marginal revenue of group 2
MC: Marginal cost
-Perfect price discrimination occurs when:
A) each customer is charged the maximum price that each is willing and able to pay.
B) two classes of customers are charged different prices as they have the same elasticities of demand.
C) senior citizens are offered restaurant discounts.
D) the firm sets MR < MC for each class of customers.
E) the firm charges same price to different customers so that it is equal to the equilibrium price.
Correct Answer:
Verified
Q60: The table given below shows the prices
Q61: The following table shows the marginal revenues
Q62: The following figures show the demand and
Q63: The figure given below shows the demand
Q64: The following figure shows the revenue curves
Q66: The following figure shows the revenue curves
Q67: The figure below shows the market equilibrium
Q68: The figure given below shows the demand
Q69: The following table shows the marginal revenues
Q70: The figure below shows the market equilibrium
Unlock this Answer For Free Now!
View this answer and more for free by performing one of the following actions

Scan the QR code to install the App and get 2 free unlocks

Unlock quizzes for free by uploading documents