The following figures show the demand and cost curves of a perfectly competitive firm and a monopoly respectively.Figure 11.7
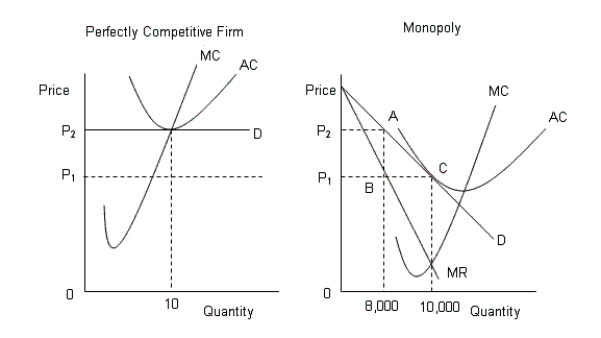 D: Average Revenue
AC: Average cost
MC: Marginal cost
MR: Marginal cost
-According to Figure 11.7, when the monopolist is maximizing profit:
A) its resources are not being used efficiently.
B) its price is higher than that charged by the perfectly competitive firm.
C) its price is equal to the price charged by the perfectly competitive firm.
D) a firm in perfect competition is earning above-normal profit.
E) a firm in perfect competition is incurring a loss.
Correct Answer:
Verified
Q57: The table given below shows the price,
Q58: The table given below shows the price,
Q59: The following figure shows the revenue and
Q60: The table given below shows the prices
Q61: The following table shows the marginal revenues
Q63: The figure given below shows the demand
Q64: The following figure shows the revenue curves
Q65: The figure given below shows the demand
Q66: The following figure shows the revenue curves
Q67: The figure below shows the market equilibrium
Unlock this Answer For Free Now!
View this answer and more for free by performing one of the following actions

Scan the QR code to install the App and get 2 free unlocks

Unlock quizzes for free by uploading documents