The figure given below shows revenue and cost curves of a monopolistically competitive firm.Figure: 12.1
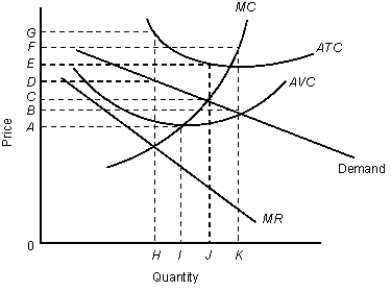 In the figure,
MR: Marginal revenue curve
ATC: Average total cost curve
AVC: Average variable cost curve
MC: Marginal cost curve
-Consider the monopolistically competitive firm described in the Figure 12.1. The profit-maximizing output level and price are _____ and _____ respectively.
A) 0; 0
B) H; D
C) I; A
D) J; C
E) J; E
Correct Answer:
Verified
Q9: The figure given below shows the cost
Q10: The figure given below shows revenue and
Q11: The figure given below shows the cost
Q12: The figure below shows the revenue and
Q13: The figure below shows the revenue and
Q15: The figure given below shows revenue and
Q16: The figure given below shows the cost
Q17: The figure given below shows the cost
Q18: The figure given below shows the cost
Q19: The figure given below shows the cost
Unlock this Answer For Free Now!
View this answer and more for free by performing one of the following actions

Scan the QR code to install the App and get 2 free unlocks

Unlock quizzes for free by uploading documents