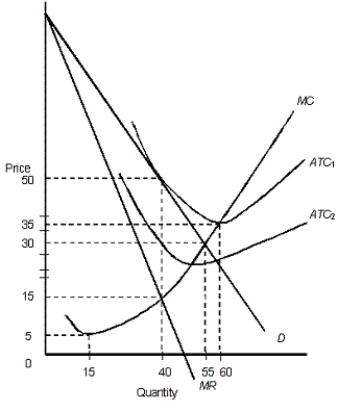
The figure below shows the revenue and cost curves of a monopolistically competitive firm.Figure: 12.2
 In the figure,
D: Demand curve
MR: Marginal revenue curve
ATC1 and ATC2: Average total cost curves
MC: Marginal cost curve
-In Figure 12.2, if the market is monopolistically competitive, which quantity represents long-run equilibrium for the firm?
A) 15
B) Between 15 and 40
C) 40
D) 55
E) 60
Correct Answer:
Verified
Q8: The figure given below shows the cost
Q9: The figure given below shows the cost
Q10: The figure given below shows revenue and
Q11: The figure given below shows the cost
Q12: The figure below shows the revenue and
Q14: The figure given below shows revenue and
Q15: The figure given below shows revenue and
Q16: The figure given below shows the cost
Q17: The figure given below shows the cost
Q18: The figure given below shows the cost
Unlock this Answer For Free Now!
View this answer and more for free by performing one of the following actions

Scan the QR code to install the App and get 2 free unlocks

Unlock quizzes for free by uploading documents