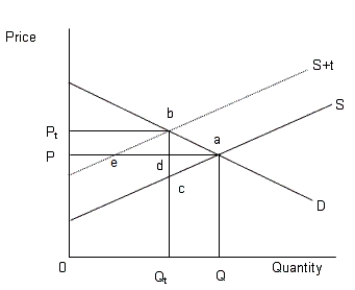
The figure given below shows the demand and supply curves of automobiles.Figure 13.3
In the figure,
D: Demand curve of automobiles
S: Supply of automobiles prior to the tax
S+t: Supply of automobiles after the tax

-Which of the following is an example of the command approach to regulation?
A) The sale of tradable permits to emit sulfur dioxide in the Chicago Mercantile Exchange
B) Enforcing private property rights and private ownership of elephants in Africa
C) Zoning in many areas that restricts the types of buildings that can be built
D) The government providing subsidies for public education
E) A Pigouvian tax
Correct Answer:
Verified
Q41: The figure given below shows the demand
Q42: Overfishing along the coastline of Helsking village
Q43: Q44: Overfishing along the coastline of Helsking village Q45: The figure given below shows the demand Q47: The figure given below shows the demand Q48: Overfishing along the coastline of Helsking village Q49: The figure below shows the demand and Q50: The figure given below shows the demand Q51: Overfishing along the coastline of Helsking village![]()
Unlock this Answer For Free Now!
View this answer and more for free by performing one of the following actions

Scan the QR code to install the App and get 2 free unlocks

Unlock quizzes for free by uploading documents