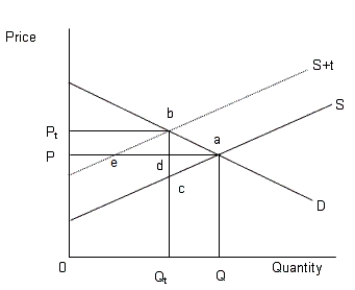
The figure given below shows the demand and supply curves of automobiles.Figure 13.3
In the figure,
D: Demand curve of automobiles
S: Supply of automobiles prior to the tax
S+t: Supply of automobiles after the tax

-When the government tries to control pollution through cap and trade, it _____.
A) issues permits that enables the owners of the permit to pollute
B) allows polluting firms to produce public goods that reduce pollution
C) levies tax on the polluting firm
D) gives subsidies to the firms who adopt clean production technologies
E) takes legal actions against the firms who pollute beyond the specified level
Correct Answer:
Verified
Q42: Overfishing along the coastline of Helsking village
Q43: Q44: Overfishing along the coastline of Helsking village Q45: The figure given below shows the demand Q46: The figure given below shows the demand Q48: Overfishing along the coastline of Helsking village Q49: The figure below shows the demand and Q50: The figure given below shows the demand Q51: Overfishing along the coastline of Helsking village Q52: The figure given below shows the demand![]()
Unlock this Answer For Free Now!
View this answer and more for free by performing one of the following actions

Scan the QR code to install the App and get 2 free unlocks

Unlock quizzes for free by uploading documents