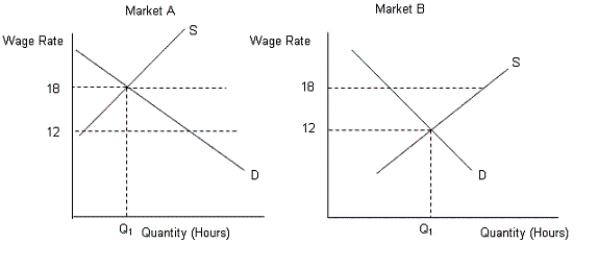
The figures given below show the demand (D) and supply (S) curves of labor in two different markets.Figure 16.3
-An individual is induced to change his/her occupation if:
A) the sunk cost of the current occupation is high.
B) the expected net gains from the alternative occupation is negative.
C) the outlook for future income, in the current occupation, increases.
D) he/she has devoted a lot of money, time and effort in the current occupation.
E) the marginal cost of remaining in the current occupation is very high.
Correct Answer:
Verified
Q35: The figure given below shows the demand
Q36: The figures given below show the demand
Q37: The figures given below show the demand
Q38: The figures given below show the demand
Q39: The figures given below show the demand
Q41: The figure given below shows the income-leisure
Q42: The figure given below shows the income-leisure
Q43: The figure given below shows the income-leisure
Q44: The figure given below shows the demand
Q45: The figure given below shows the income-leisure
Unlock this Answer For Free Now!
View this answer and more for free by performing one of the following actions

Scan the QR code to install the App and get 2 free unlocks

Unlock quizzes for free by uploading documents