The figure given below shows the income-leisure trade off of an individual.Figure 16.5
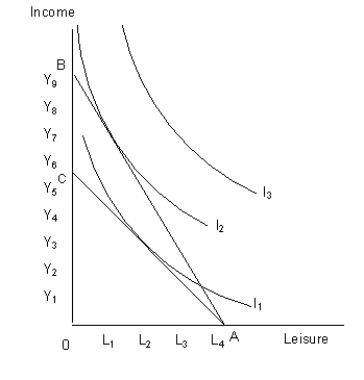 AB and AC: Income constraints of the individual
I1, I2, and I3 curves show the income leisure choices of the individual.
-A regressive tax structure is one:
A) in which the tax increases as the base increases.
B) in which the tax rate remains the same as the base increases.
C) that tends to discourage additional work as income rises.
D) that is famous and in use in the U.S.
E) in which the tax rate increases as the base increases.
Correct Answer:
Verified
Q37: The figures given below show the demand
Q38: The figures given below show the demand
Q39: The figures given below show the demand
Q40: The figures given below show the demand
Q41: The figure given below shows the income-leisure
Q43: The figure given below shows the income-leisure
Q44: The figure given below shows the demand
Q45: The figure given below shows the income-leisure
Q46: The figure given below shows the income-leisure
Q47: The figure given below shows the income-leisure
Unlock this Answer For Free Now!
View this answer and more for free by performing one of the following actions

Scan the QR code to install the App and get 2 free unlocks

Unlock quizzes for free by uploading documents