The figure given below shows the import demand and export supply curves of corn in the U.S. and Mexico.Figure 20.2
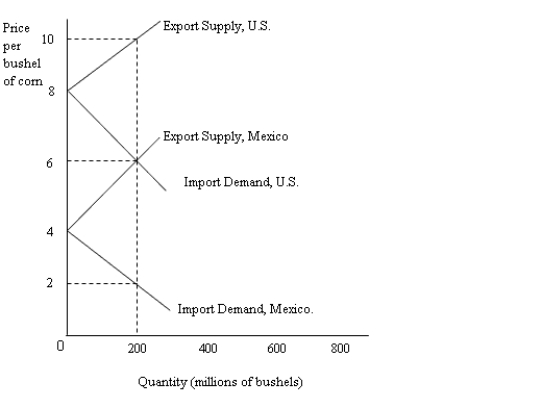
-Refer to Figure 20.2. The no-trade equilibrium price of a bushel of corn in Mexico is:
A) $2.
B) $4.
C) $6.
D) $8.
E) $10.
Correct Answer:
Verified
Q68: The table below shows the quantity demanded
Q69: The figure given below shows the import
Q70: The table below shows the quantity demanded
Q71: The table below shows the quantity demanded
Q72: The table below shows the quantity demanded
Q74: The table below shows the quantity demanded
Q75: The table below shows the quantity demanded
Q76: The table below shows the quantity demanded
Q77: The table below shows the quantity demanded
Q78: The table below shows the quantity demanded
Unlock this Answer For Free Now!
View this answer and more for free by performing one of the following actions

Scan the QR code to install the App and get 2 free unlocks

Unlock quizzes for free by uploading documents