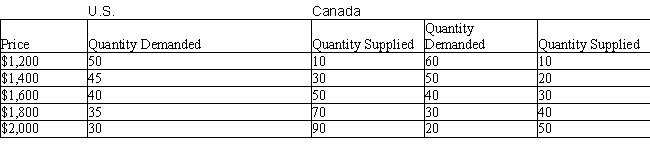
The table below shows the quantity demanded (in thousands) and quantity supplied (in thousands) of computers in the U.S. and Canada at different prices.Table 20.5
-According to the Ricardian model, the source of comparative advantage is:
A) differences in labor productivity in different countries.
B) differences in foreign trade policies followed by the government of various countries.
C) differences in resource endowments of an economy.
D) differences in the fields of research and development in a country.
E) differences in the taste and preferences of the consumers in different countries.
Correct Answer:
Verified
Q69: The figure given below shows the import
Q70: The table below shows the quantity demanded
Q71: The table below shows the quantity demanded
Q72: The table below shows the quantity demanded
Q73: The figure given below shows the import
Q75: The table below shows the quantity demanded
Q76: The table below shows the quantity demanded
Q77: The table below shows the quantity demanded
Q78: The table below shows the quantity demanded
Q79: The table below shows the quantity demanded
Unlock this Answer For Free Now!
View this answer and more for free by performing one of the following actions

Scan the QR code to install the App and get 2 free unlocks

Unlock quizzes for free by uploading documents