The figure given below depicts the negatively sloped demand and positively sloped supply curves of wheat in a country.Figure 21.2
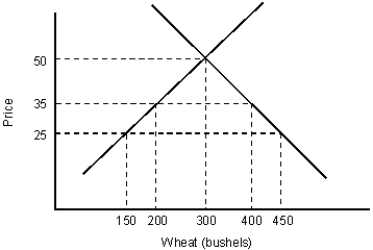
-In Figure 21.2, if the world price of wheat is $25 and a $10 tariff is imposed:
A) imports will decrease from 300 to 200 bushels of wheat.
B) imports will increase from 200 to 400 bushels of wheat.
C) imports will remain unchanged.
D) domestic production will decrease from 200 to 150 bushels of wheat.
E) domestic production will remain unchanged.
Correct Answer:
Verified
Q38: The table below shows the quantity demanded
Q39: The table below shows the quantity demanded
Q40: The table below shows the quantity demanded
Q41: The figure given below depicts the negatively
Q42: The figure below shows the demand (D)
Q44: The figure below shows the demand (D)
Q45: The figure given below depicts the negatively
Q46: The figure given below depicts the negatively
Q47: The figure given below depicts the negatively
Q48: The figure given below depicts the negatively
Unlock this Answer For Free Now!
View this answer and more for free by performing one of the following actions

Scan the QR code to install the App and get 2 free unlocks

Unlock quizzes for free by uploading documents