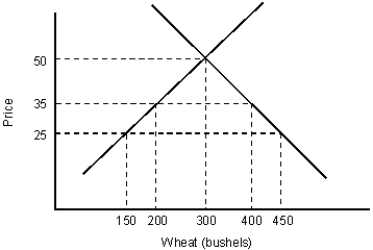
The figure given below depicts the negatively sloped demand and positively sloped supply curves of wheat in a country.Figure 21.2
-By restricting the amount of a good that may be imported:
A) quotas, increase prices, thus causing domestic producers to sell less than they would with free trade.
B) tariffs lower prices, thus allowing domestic producers to sell more than they would with free trade.
C) quotas increase prices, thus allowing domestic producers to sell more at higher prices than they would with free trade.
D) tariffs lower prices, thus causing domestic producers to realize lower total revenue.
E) quotas simply replace foreign production with domestic production.
Correct Answer:
Verified
Q41: The figure given below depicts the negatively
Q42: The figure below shows the demand (D)
Q43: The figure given below depicts the negatively
Q44: The figure below shows the demand (D)
Q45: The figure given below depicts the negatively
Q47: The figure given below depicts the negatively
Q48: The figure given below depicts the negatively
Q49: The figure given below depicts the negatively
Q50: The figure given below depicts the negatively
Q51: The figure below shows the demand (D)
Unlock this Answer For Free Now!
View this answer and more for free by performing one of the following actions

Scan the QR code to install the App and get 2 free unlocks

Unlock quizzes for free by uploading documents