The figure below shows the demand (D) and supply (S) curves of corn syrups.Figure 21.3
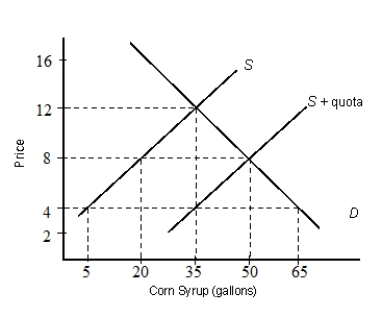
-In Figure 21.3, what are the equilibrium price and quantity in the absence of trade?
A) $8, 50 gallons
B) $12, 35 gallons
C) $8, 35 gallons
D) $4, 20 gallons
E) $16, 50 gallons
Correct Answer:
Verified
Q46: The figure given below depicts the negatively
Q47: The figure given below depicts the negatively
Q48: The figure given below depicts the negatively
Q49: The figure given below depicts the negatively
Q50: The figure given below depicts the negatively
Q52: The figure below shows the demand (D)
Q53: The figure given below depicts the negatively
Q54: The figure given below depicts the negatively
Q55: The figure below shows the demand (D)
Q56: The figure below shows the demand (D)
Unlock this Answer For Free Now!
View this answer and more for free by performing one of the following actions

Scan the QR code to install the App and get 2 free unlocks

Unlock quizzes for free by uploading documents